- Contact Us

With a name inspired by the mythical Alethiometer, from Philip Pullman’s “The Golden Compass”, our Alethiyom platform seeks to find the “truth” hidden in data.
But unlike the fictional gadget that required years of training to master, we’re focused on creating the best user experience – one that empowers people to ask and answer complex questions without learning new querying languages or becoming a data scientist.
We achieve this by building a platform that integrates, manages and secures linked graph data. Decision making applications are layered on top to create a fully interactive human-driven, machine-assisted analysis.
Organizations have data. Lots of it. Structured data like log files, spreadsheets, and tables. Unstructured data like emails, documents, images, and videos.
The people who rely on this data don't think in terms of rows, columns, or raw text. They think in terms of their organization's mission and the challenges it faces. They need a way to ask questions about their data and receive answers in a language they understand.
Working closely with the customer, our engineers integrate and map all of the relevant source data—regardless of type or volume—into a single, coherent model.
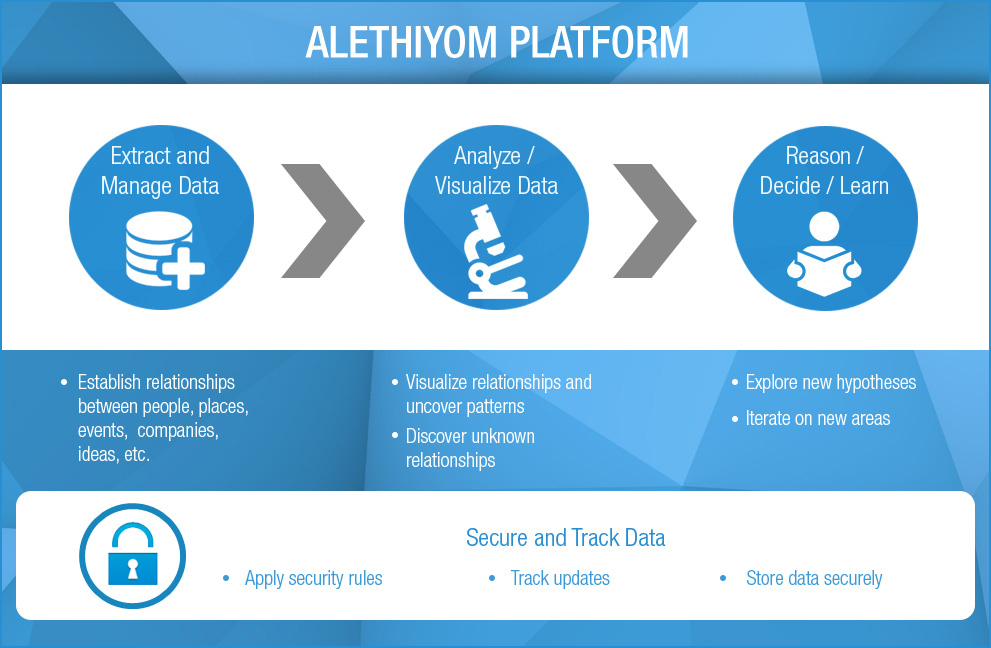
As data flows into the platform, it’s transformed into meaningfully defined objects and relationships: people, places, things, events, and the connections between them.
Once the model has been created, data flows continuously from its sources into the platform. Security rules are applied along the way, so data is only accessible to authorized users.
Any updates to the source data are pushed to the platform, and as users build their analyses, all their actions are automatically tracked, attributed, and stored.
Users interact with the data through a variety of integrated applications built on top of the platform. All data sources can be searched at once to visualize relationships, explore divergent hypotheses, discover unknown connections, bring hidden patterns to the surface, and share insights with their colleagues.
By reducing friction between users and their data, our platform augments the intelligence of the entire enterprise.
Users begin to enrich their understanding of the data by building and performing computations over models with the help of a rich library of statistical and mathematical operators.
Simple models can serve as building blocks of more complex models—building out sophisticated analyses becomes a streamlined, modular process. Anything the analyst can imagine can be easily and quickly expressed.
The platform’s interactive user interface brings abstract concepts to life in the form of rich visualizations. Tables, scatter plots, and charts interact seamlessly to provide a holistic view of all integrated data of interest.
Visualizations update in real-time with the source data so users always see the most accurate and current information at any given time.
Because each new analysis raises as many questions as it answers, our platform is built for rapid iteration and collaboration.
Analysts can tweak their logic, test new hypotheses, and present new findings to decision-makers who review the analysis, gain a better understanding, and ask new questions. The enterprise gets smarter, and the cycle continues.